


Having surpassed the opening third of the 2025 AFL season, fans have managed to understand their team's strengths and weaknesses for the current campaign.
The game styles and standout stars have heavy influences on which metric each side has become renowned for, with some clubs focused on fast-paced football and territory, while others lead the inside hustle and contested facet of the game.
Each club leads at least one statistic so far this year, with some dominating key areas of the game while others have struggled to go No.1 in a crucial category.
Here's the stat your team is leading to start the season...
Adelaide
Goals Kicked (15.2 Per Game)
The Crows have been a force in their front-half this year, with the breakout of Riley Thilthorpe, the accuracy of Darcy Foagrty and the livwire presence of Josh Rachele, Izak Rankine and Ben Keays all playing a part.
Fogarty is going at a team-high 2.6 goals per game, while all of Thilthorpe, Taylor Walker, Keays, Rachele, Rankine, Alex Neal-Bullen and even Brodie Smith have managed a mean of at least one goal per game this year.
The South Australian side also ranks No.1 in the competition for goal assists, goal accuracy, goals per inside 50 and scores from turnovers to aid their strong scoring run, while they also rank top in the competition for intercept possessions and hard-ball gets.
Stunningly, the Crows have had the fourth-fewest goal kickers in 2025, managing a total of 20 for the year so far.
Brisbane
Clearances (42.6 Per Game)
With Lachie Neale, Josh Dunkley, Will Ashcroft and Hugh McCluggage leading your midfield, it's no surprise the Queenslanders are No.1 for clearances per game.
All four Lions midfielders average at least 5.6 clearances each outing, while ruckmen Oscar McInerney and Darcy Fort have been serviceable.

The Lions rank top of the AFL for stoppage clearances, racking up close to 30 per game in 2025, while they also lead the league for kicks and marks.
Carlton
Contested Possessions (140.2 Per Game)
The Blues' engine room ensemble is one of the best in and under the contest, led by captain Patrick Cripps and in-form veteran George Hewett.
Hewett's career-best year has him ranking seventh in the AFL for contested possessions per game, with Cripps 10th overall.
As a collective, Carlton's midfield remains a contested beast, while Michael Voss' side also ranks No.1 for tackles per game this year
Collingwood
Opponent Points Scored (70.6 Per Game)
The Magpies' stingy defence has led to just 635 points conceded in their nine matches this year.
It's a stellar outcome for Craig McRae's rearguard, who have been forced to reshuffle their backline stocks on numerous occasions.
The Magpies have conceded 100 points in a game just once - their season opener against GWS - and have kept teams to 70 or fewer points five times.
Essendon
Disposals (387.4 Per Game)
The Bombers have been this year's ball magnets, having 10 players averaging 20 or more disposals this year.
Captain Zach Merrett has led that metric for Essendon, going at 29.8 per game, while Jye Caldwell (27.0) and Nic Martin (24.3) have also been glowing.
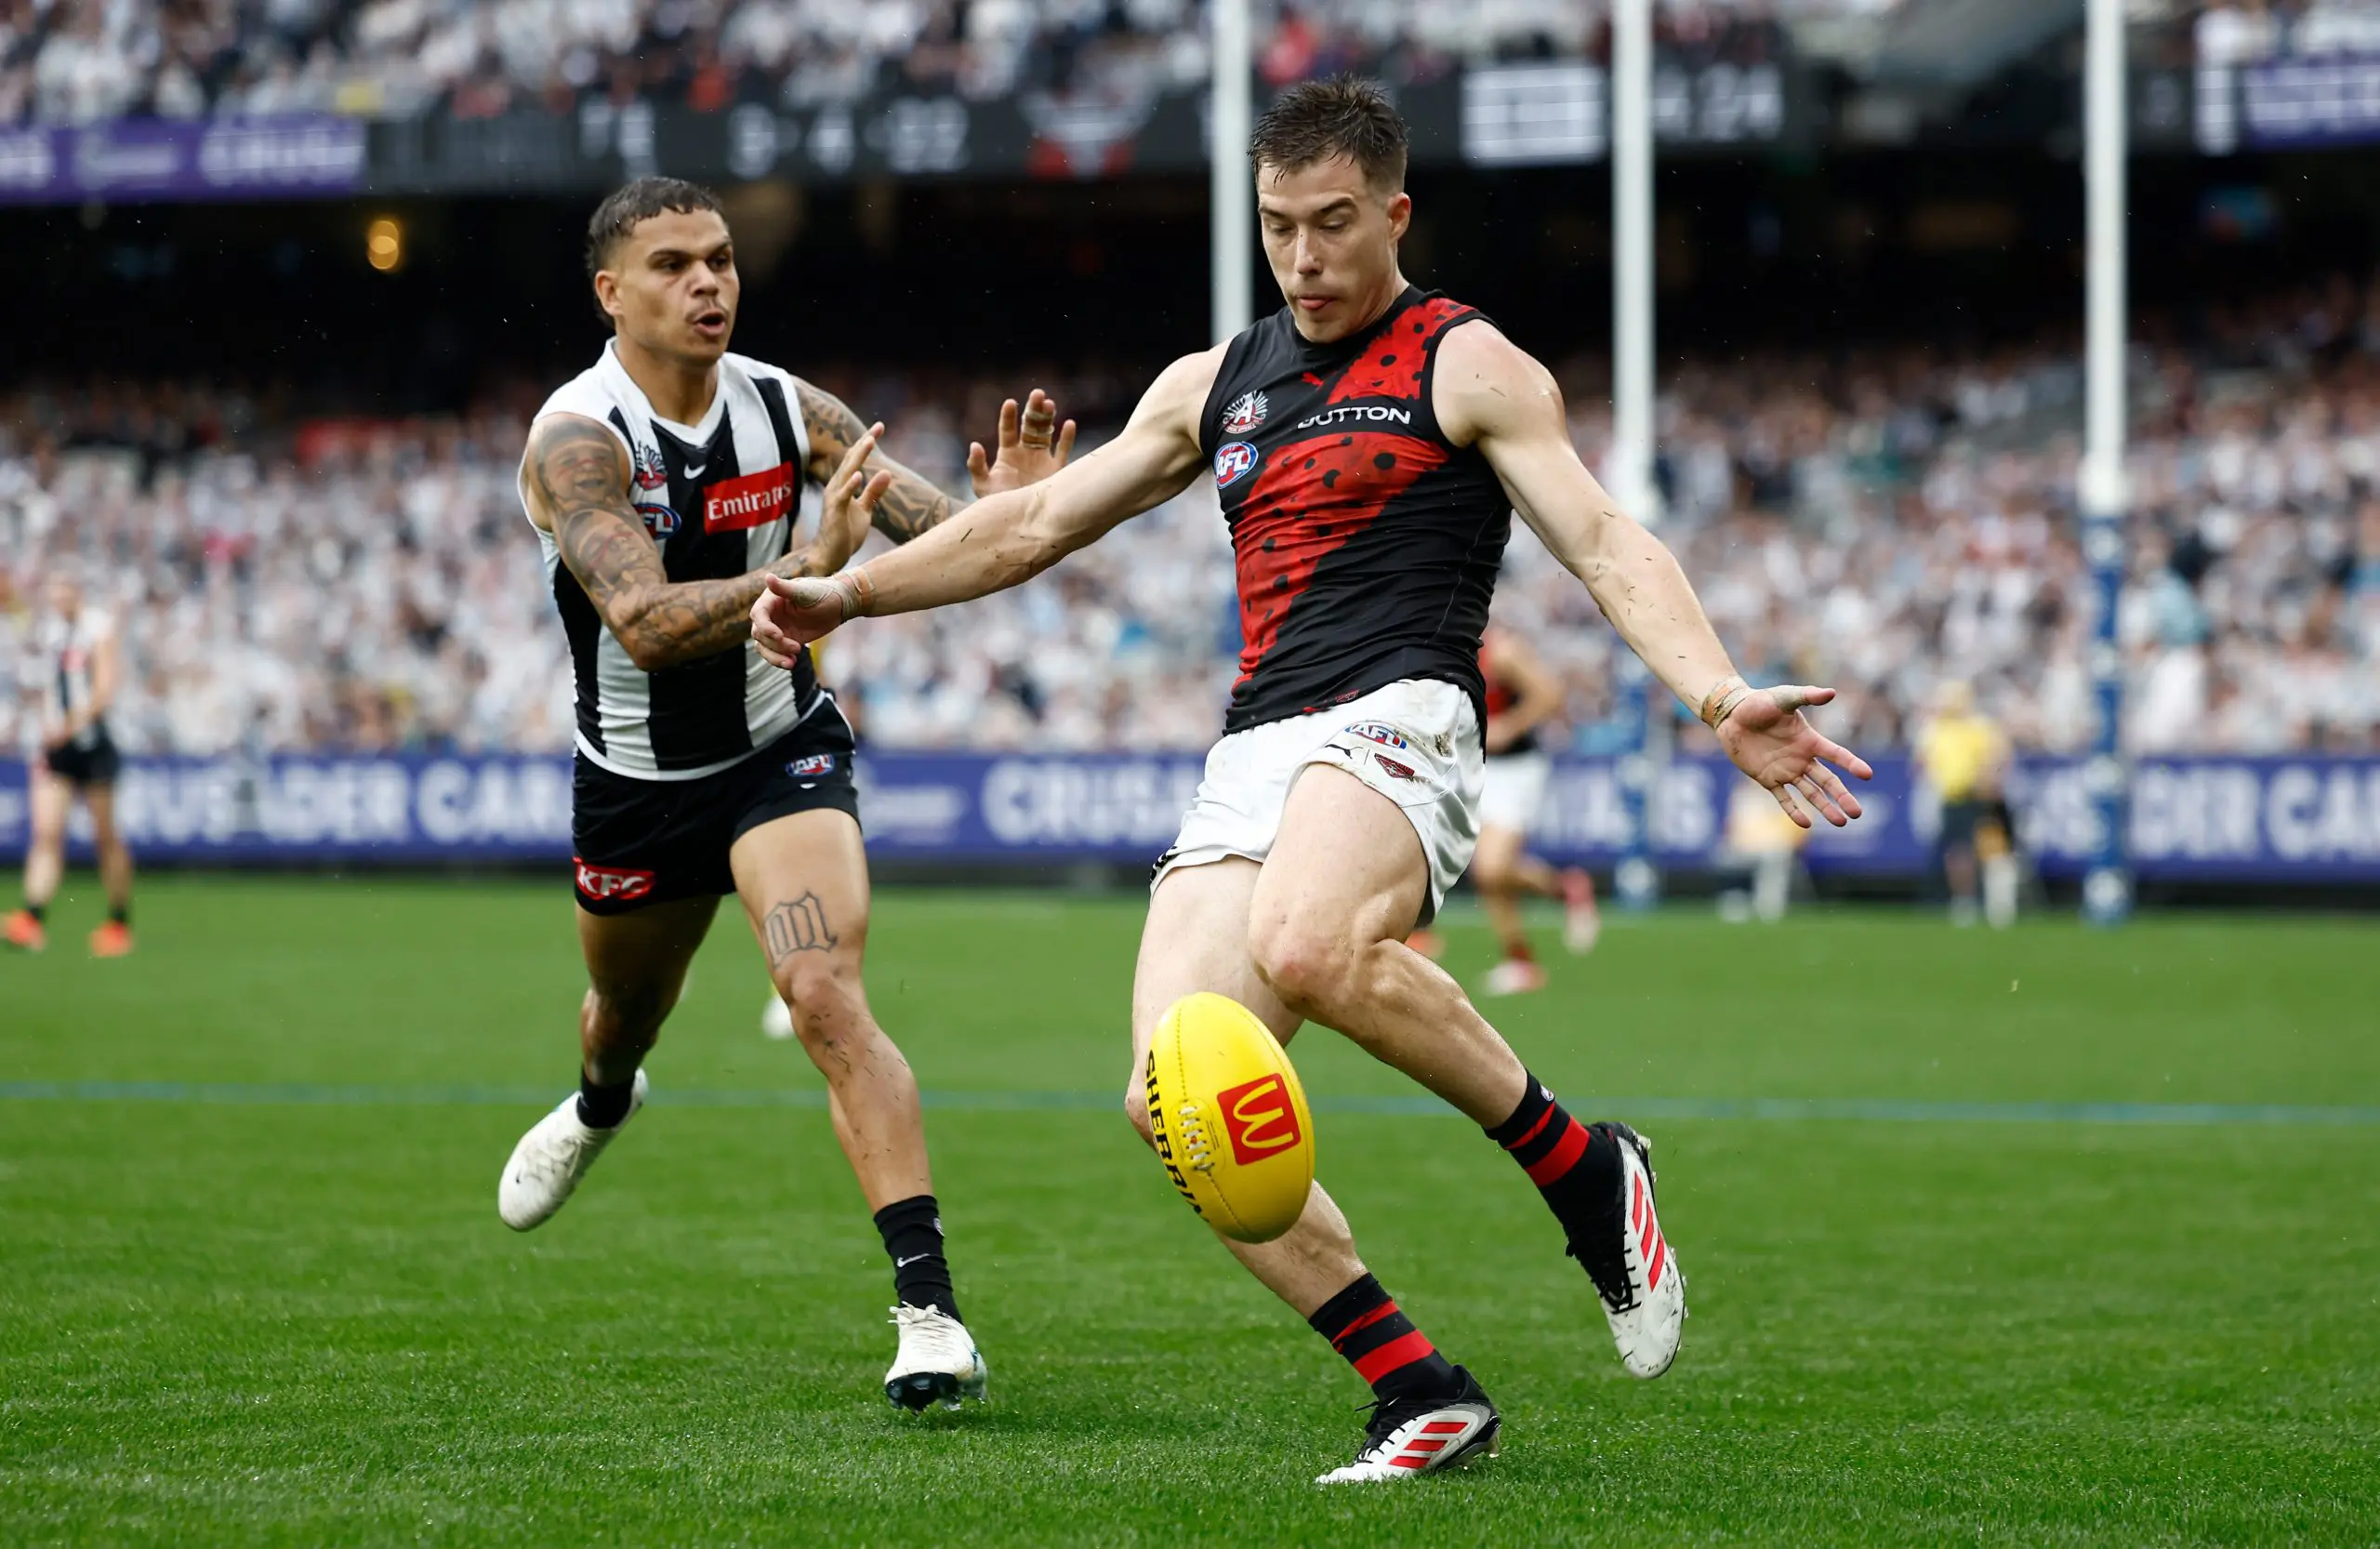
Despite having one fewer game played, Essendon have more touches in 2025 than Geelong, Richmond and West Coast.
They also rank No.1 overall for handballs per game and fifth for kicks.
Fremantle
Kicking Efficiency (68.6%)
Despite their up-and-down start to 2025, the Dockers have been the cleanest movers of the ball by foot.
It's an impressive metric to lead for Justin Longmuir's men, who rank top five for metres gained per disposal.
Their backline leads the way at Cockburn, with all of Luke Ryan, Alex Pearce, James Aish, Karl Worner, Brandon Walker, Joshua Draper and Brennan Cox going at over 78% or better.
Geelong
Tackles Inside 50 (14.9 Per Game)
The Cats' small forwards have often been a menace for the opposition, the the stats prove it.
Geelong's 14.9 tackles inside 50 per game is 0.9 more than the next best in Carlton, who are the only two clubs with more than 12.8 per game.
Tyson Stengle (2.2 tackles inside 50 per game), Shaun Mannagh (2.0) and tackling machine Tom Atkins (1.6) lead the way for the Cats in this column.
Gold Coast
Metres Gained (6347.8 Per Game)
The Suns lead plenty of stats in 2025, with Damien Hardwick's men sitting No.1 for points, hitouts, hitout win rating, inside 50s and shots on goal.
But the key metric that Hardwick will be happy leading is the metres gained column, with the champion coach keen on dominating the territory game.

The Suns average over 100 more metres than the next best side in GWS, while Gold Coast are also No.1 in the game for metres gained per disposal at 18.2.
GWS
Points Scored from Kick-Ins (8.3 Per Game)
The Orange Tsumani plans to move the ball as effectively and quickly as possible from one end to the other, damaging the opposition on transition.
It's a good reason why the Giants lead the league for scores from kick-ins per game, quickly flicking the switch on the counterattack.
The Giants also rate second in the competition for scores from turnovers, showing the value of Adam Kingsley's system.
Hawthorn
Marks Inside 50 (15.9 Per Game)
Hawks champion Jack Gunston's return to form has been a big piece in the Waverley side sitting near the top of the ladder, with the veteran spearhead a threatening target in attack.
Gunston is averaging four marks inside 50 per game, a stat that has helped him sit among the top of goalkickers this year.
Aerial threat Mabior Chol goes at 2.3 per game, while Connor MacDonald, Nick Watson, Blake Hardwick and Dylan Moore each average more than one mark inside 50 per outing.
Melbourne
Hitouts To Advantage (15.9 Per Game)
While it hasn't been the season the Demons would've hoped for so far, there's no questioning the pedigree of their skipper, Max Gawn.
The seven-time All-Australian ruckman has remained at the top of this game as the league's best ruckman, with his ability to find a teammate at each contest a leading trait.
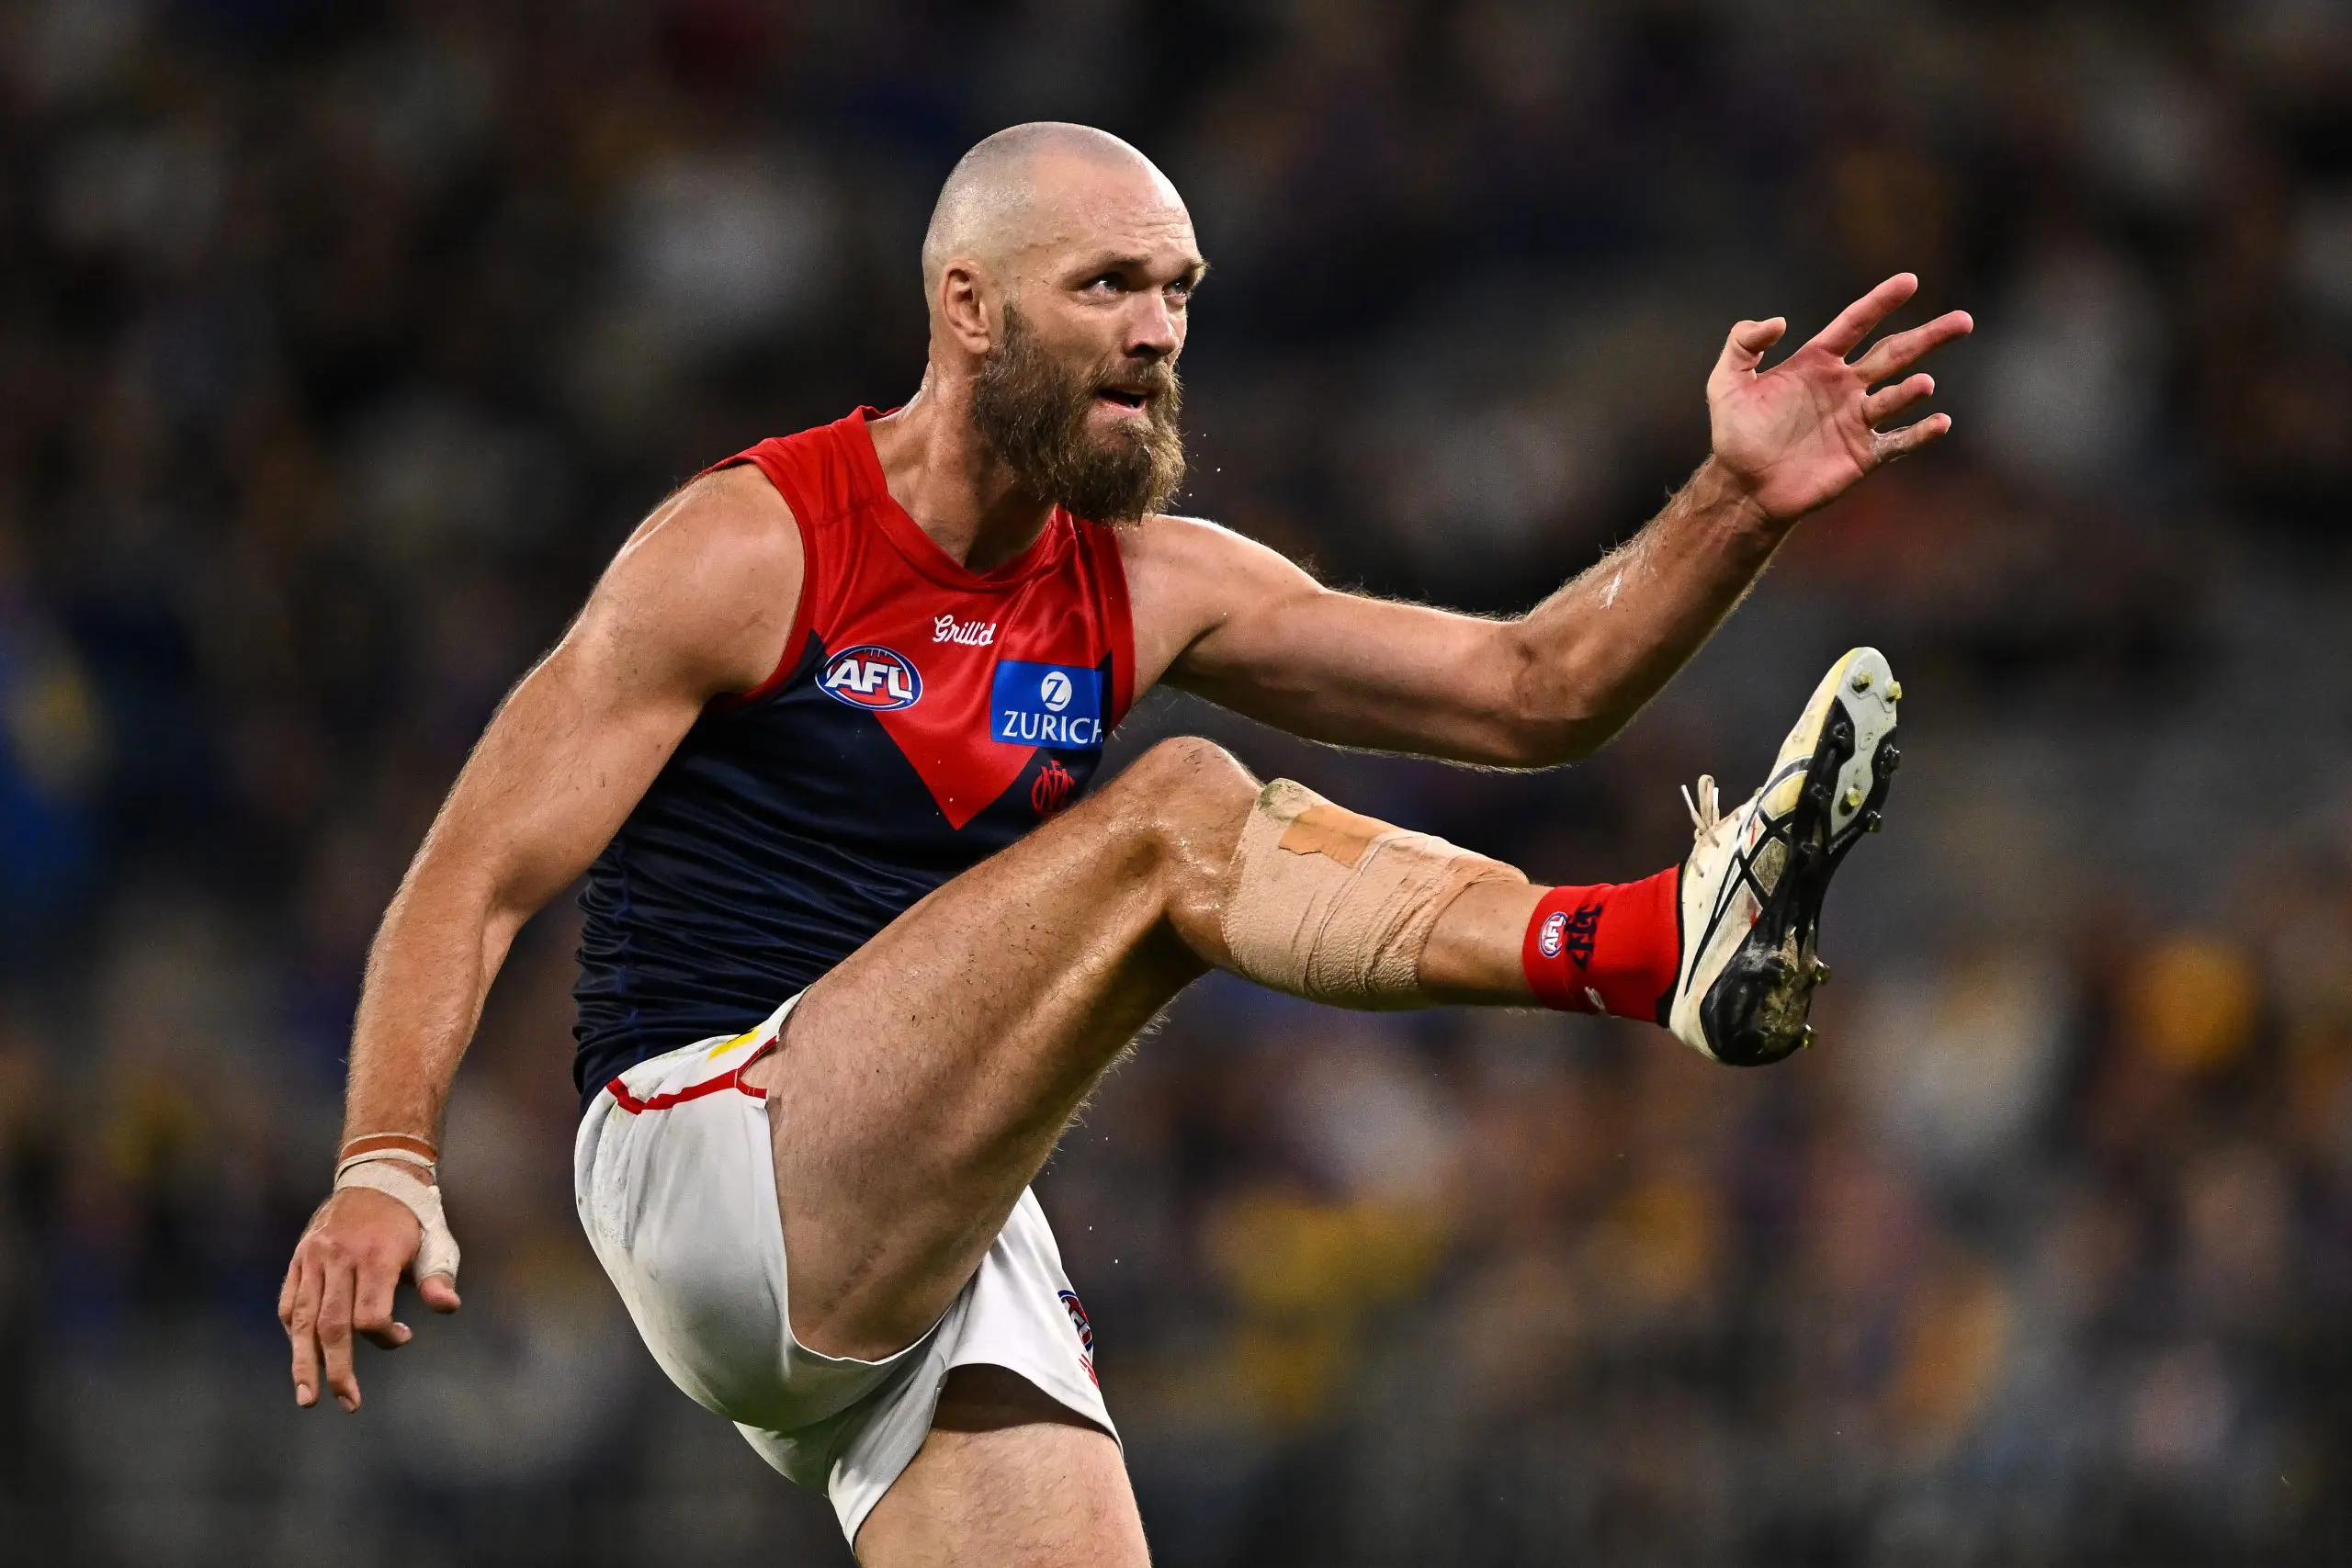
Gawn is making up 10.3 hitouts to advantage per game in 2025, with his pinch-hitting support ruckmen also doing their part to make up the numbers.
North Melbourne
Hitouts To Advantage % (31.6%)
While Gawn might still be No.1, North Melbourne's Tristan Xerri is closing in.
The Roos big man made his case for a maiden All-Australian blazer last year and is doing so again in 2025, with 34% of his hitouts going to the advantage of a Roos midfielder.
That puts him No.1 in the competition among rucks who have attended at least 100 ruck contests in 2025.
Port Adelaide
Opposition Marks (74.0 Per Game)
The Power don't lead any of the traditional metrics, but they have managed to quell the oppposition's ability to retain possession by foot.
Port Adelaide's 74 opposition marks per game is a huge low, with only three other clubs managing to concede under 80.4
Three clubs go at over 100, while a further four concede at least 90 marks per game.
Richmond
Opposition Rebound 50s (32.8 Per Game)
It's hard to tell if this is a good stat to lead or not.
On one hand, the Tigers are getting bang for their back with their forward entries and aren't allowing the opposition to exit their forward 50.
But on the other hand, it could be a result of Richmond struggling to record attacking entries overall, with the Tigers ranking last in the AFL for inside 50s per game at 43.3.
Nevertheless, coach Adem Yze can be happy with his forward stocks and their balance of both pressure and efficiency in the front third.
St Kilda
Kick-In Play On % (98.1%)
The Saints don't lead any of the traditional stats, but nor do they sit last for them.
They've been a middle-ground side for most of 2025, with their pressure and forced turnover game an area they've been strong in.
But one stat St Kilda do sit No.1 for is their want to get the ball moving after conceding a behind, with the Saints having the highest play-on rate for kick-ins.
The Saints have two of the best users of the ball in Jack Sinclair and Nasiah Wanganeen-Milera, who have tallied a large majority of the club's kick-ins, and have also played on in every one they've taken.
What hasn't worked for the Saints is the outcome of their kick-ins game, managing just 2.8 points from kick-ins as a source, good for 16th in the AFL.
Sydney
Bounces (12.9 Per Game)
The Swans have three of the most renowned bouncers in the game in Riley Bice, Chad Warner and Nick Blakey, who all rank in the top 10 for bounces per game.
First-year defender Bice leads the way with 3.1 per outing, good for fourth in the AFL, with All-Australia duo Warner and Blakey both managing at least 1.8 per game.
The Swans have managed to find space and accelerate on the run, creating opportunities for their best attacking weapons.

West Coast
Kick-Ins (14.0 Per Game)
It's not exactly the stat you want to lead, but it's the one the Eagles do.
West Coast concede the most behinds of any club, going at just over 14 per game.
Add that to conceding the most goals per game at 15.8, and it's clear to see why the Eagles are struggling to remain competitive.
Western Bulldogs
Centre Clearances (15.9 Per Game)
The Dogs are one of the best clubs statistically, managing top-five placings for disposals, points, inside 50s, goal assists, clearances, handballs, metres gained and contested possessions per game, among others.
An area they lead in is the centre clearance game, with all of Tom Liberatore, Marcus Bontempelli, Ed Richards and Matthew Kennedy recording at least 2.2 per game.
Liberatore's 3.3 per game places him third overall in the competition, trailing only Caleb Serong and Matt Rowell.
The Dogs rank in the top half of the league for stoppage clearances, meaning they only trail Brisbane for total clearances.


